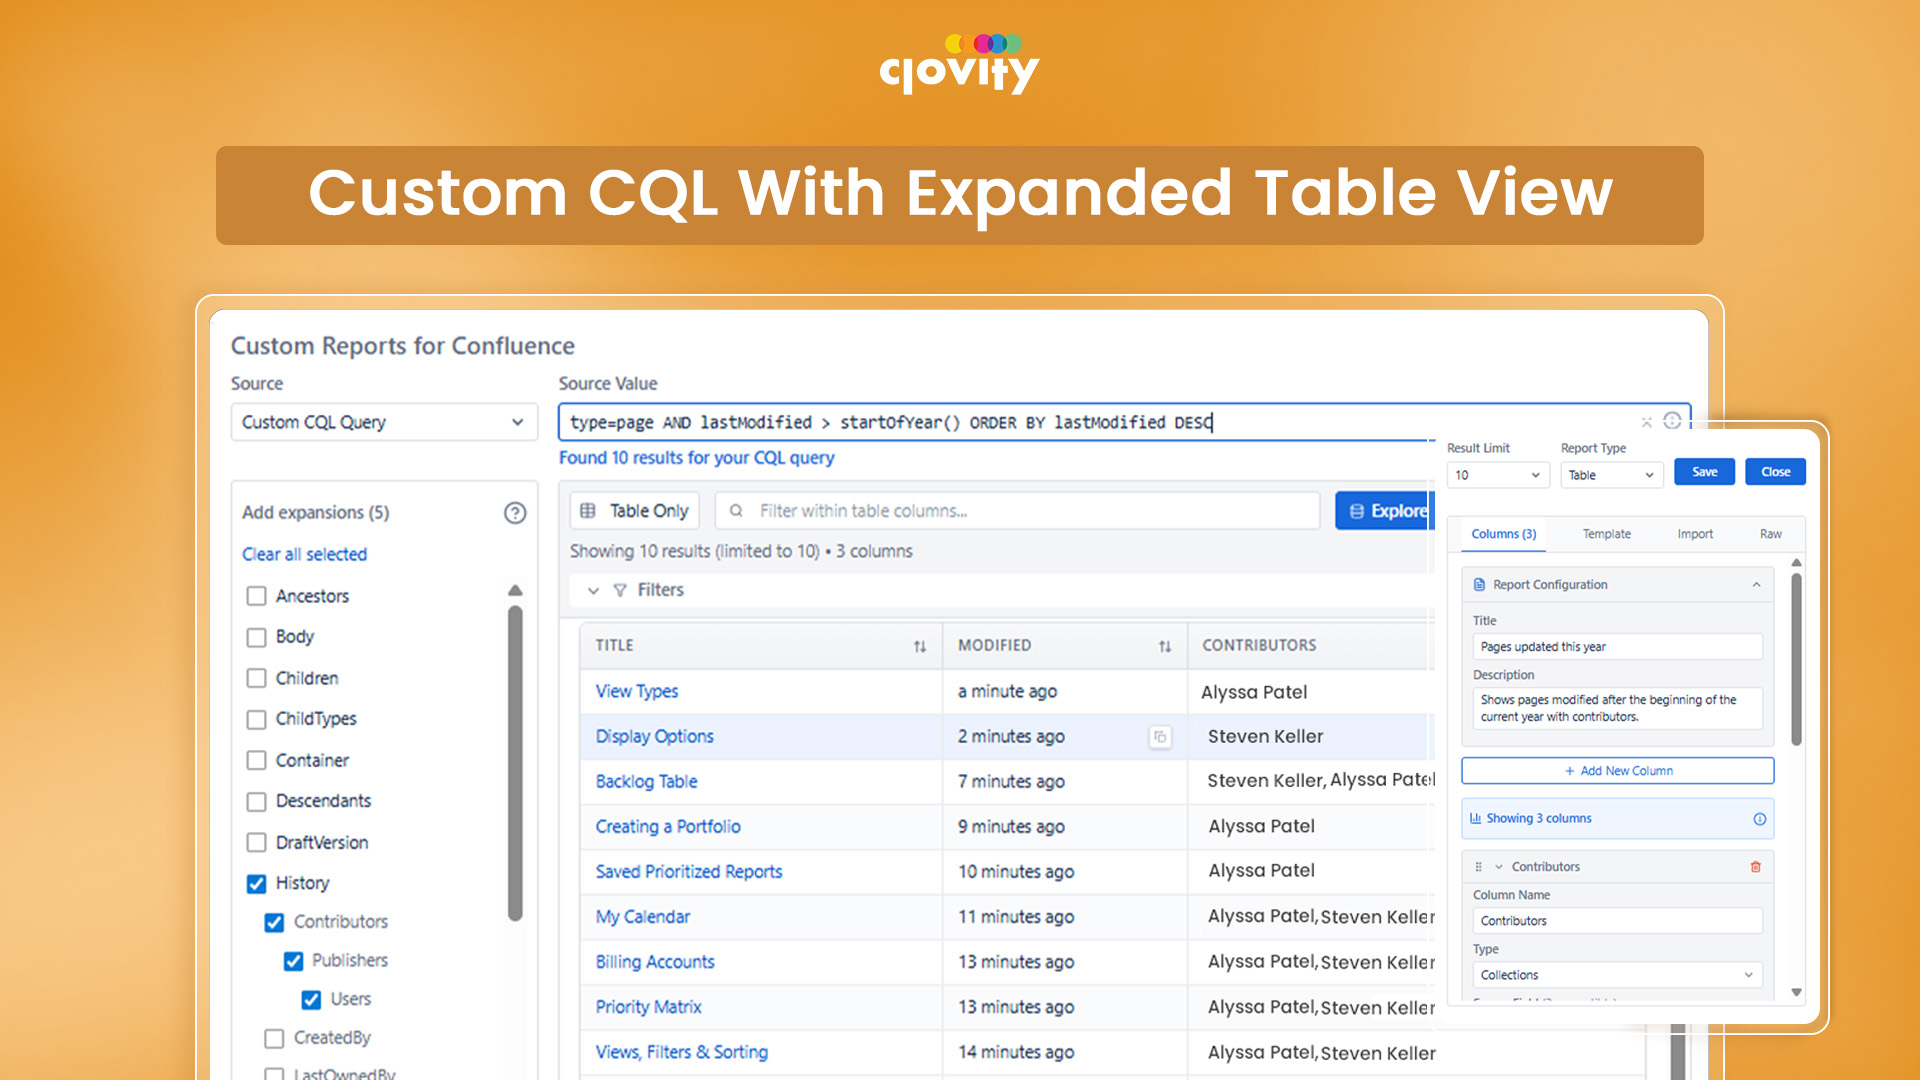
Build powerful Confluence reports using custom CQL queries and display results in an expanded, fully configurable table view with dynamic columns and expansions. Users write or select CQL expressions targeting content by space, label, author, date range, or content type — and the query engine resolves dynamic date functions like now() and startOfYear() automatically. The table view
supports sortable, paginated rows, with each column fully configurable to map any Confluence API field path including deeply nested metadata. Body expansions (history, space, labels, version, ancestors) are fetched in a two-phase approach to stay within Forge API limits — ensuring full data fidelity even across thousands of pages.
CQL query engine resolves dynamic date functions (now(), startOfYear()) automatically — no manual date substitution required
Fully configurable table columns map any Confluence API field path, including nested paths like content.history.lastUpdated.by.publicName
Two-phase expansion fetching delivers full metadata fidelity (history, labels, space, version) even at scale— no data dropped to meet API limits
Sortable, paginated table handles large Confluence instances — reports stay fast across thousands ofpages with chunked fetching
Step 2 of 3
Simplified Space & Page Filtering
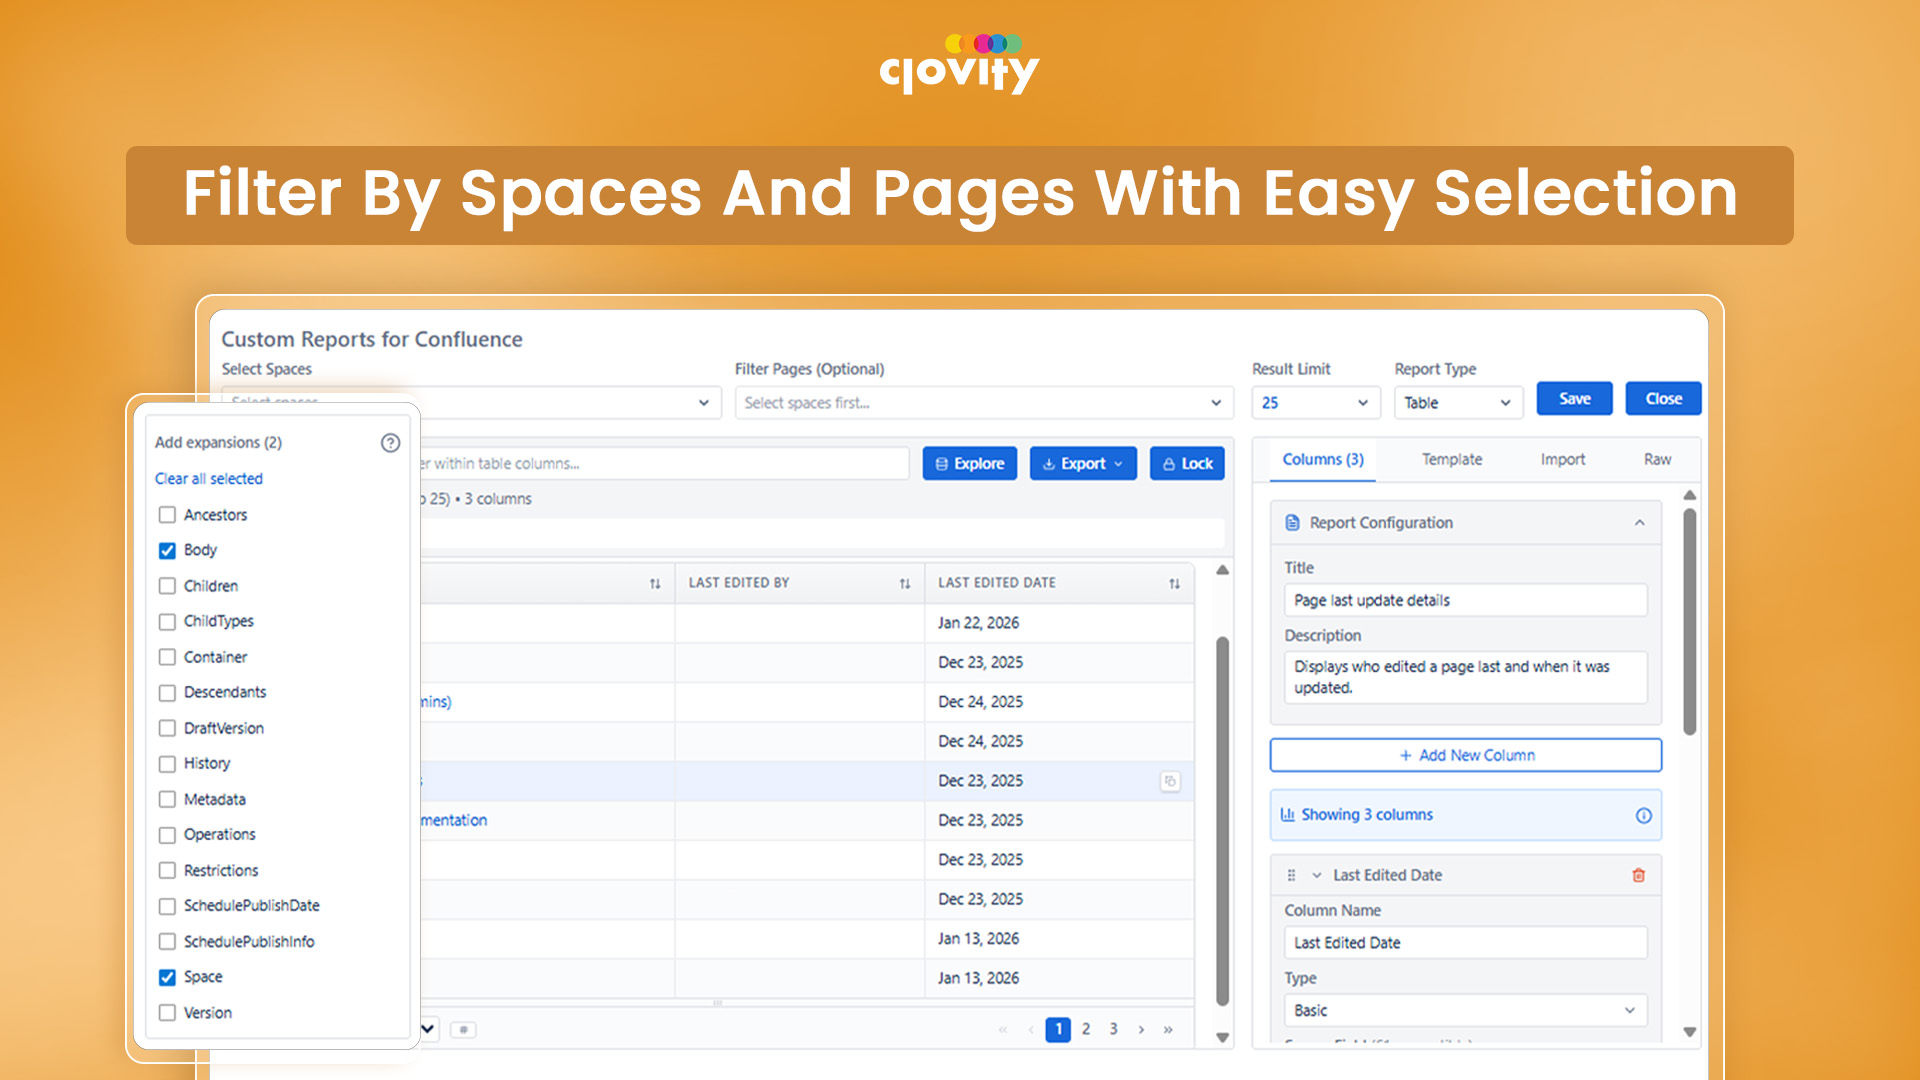
Quickly narrow down reports by choosing spaces and pages through a user-friendly interface - perfect for admins, auditors, and content managers. A searchable Space Selector lets users pick one or multiple Confluence spaces as the report scope, while a Page Selector allows targeting specific pages directly. Both selectors feed into the CQL query automatically, so users get scoped
results without writing a single line of CQL manually. This makes the app accessible to non-technical Confluence users who need accurate, space-scoped reports for governance reviews, content audits, and team-level reporting without requiring admin-level query knowledge.
Searchable Space Selector with multi-select — scope any report to one or more spaces without writing CQL manually
Page Selector enables targeted per-page reporting — ideal for auditors reviewing specific content sections or page hierarchies
Space and page filters feed directly into CQL query generation — non-technical users get precise scoped results with zero query knowledge required
Step 3 of 3
Advanced Visual Reporting for Confluence
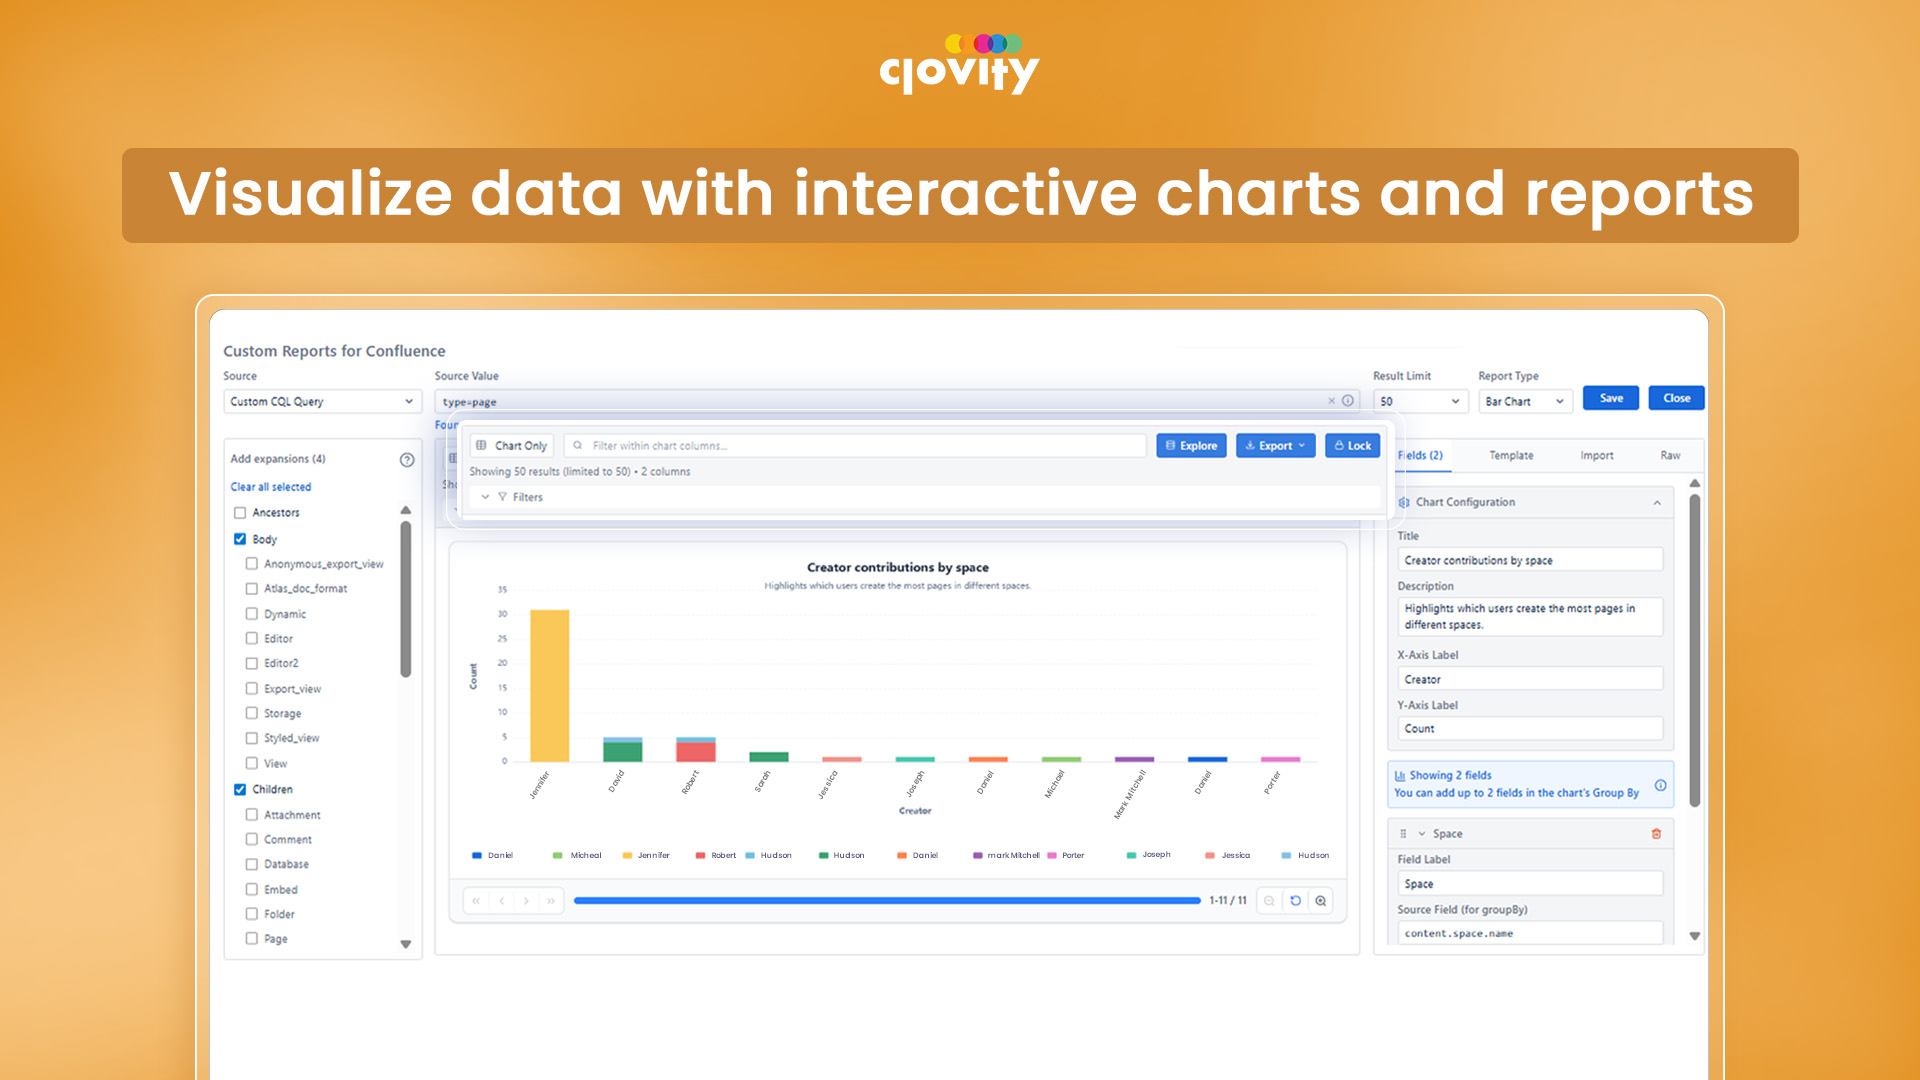
Generate powerful visual reports using custom CQL, grouped data fields, and interactive charts - ideal for audits, governance, and executive dashboards. The app provides 3 chart types powered by Apache ECharts including bar, line, and pie. Charts support configurable group-by fields — letting teams visualize content distribution, contributor activity, or publication trends across any Confluence attribute. All charts render inline within the Confluence page, giving leadership live data-fresh dashboards embedded directly in their team spaces without any external BI tool.
3 chart types (bar, line, pie) render inline in Confluence — no external BI tool or export needed
Multi-series grouping with stacking and dynamic legends — visualize content by space AND type in one chart, configured without any code
CQL-driven chart data stays live — every page load re-queries Confluence so charts always reflect the latest content without manual refresh